
Article
How Outsourced Accounting Can Alleviate Business Growing Pains
Effective May 21, 2023, P&N has joined EisnerAmper. Read the full announcement here.


Do you need more flexibility with operational reporting within Sage Intacct? Do you want the ability to pivot your data in different ways? In part two of our multipart tips and tricks series on enhancing your reporting experience in Sage Intacct, we will explore the Sage Intacct Interactive Custom Report Writer. This is the newest Sage Intacct reporting tool, aimed at making your operational reporting easier and more effective.
The Sage Intacct Interactive Custom Report Writer brings powerful Business Intelligence capabilities to operational reporting. It delivers a variety of visualizations, enables users to easily pivot and filter data, allows for drag and drop column and field creation, and so much more. Sage Intacct’s Interactive Custom Report Writer gives you the insights needed to streamline day-to-day tasks, rapidly respond to internal and external “customers”, and manage operational performance.
Sage Intacct is highlighting the new Interactive Custom Report Writer during two free live webinars presented by Sage Intacct's Linda Pinion. The Sage Intacct team will show you how to quickly and easily build basic reports, improve report usability, and address the complex needs surrounding your business.
You can sign up for one of these free webinars below:
If you are already using the Interactive Custom Report Writer, here are a few tips:
Permissions identify the report owner and specify who can and can't access this report. Users who don't have access to a report won't see it in the Interactive custom reports list and it won't appear in the Reports Center or dashboards.
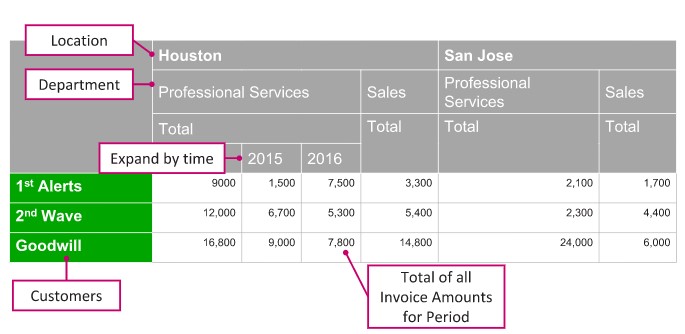
Views help you look at reports in meaningful, intuitive ways. It's the way you view (or present) your data that lets you turn a report into a useful tool. Pivot tables are a common tool used to display your data in a summarized format.
The additional prompts you can add at runtime in the Interactive Custom Report Writer are similar to filters, in that they filter the data according to the criteria you set. Unlike filters, these prompts are set up as fields that the user specifies at the time they run the report.
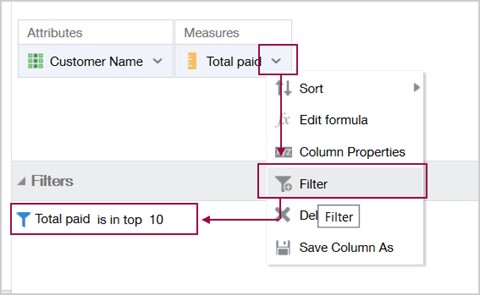
One common custom report shows the top or bottom number of an item, such as the highest or lowest performing sales by location or the top customers by revenue. This type of report can provide valuable information very quickly.
If you have questions about Sage Intacct or its functions, contact our team and we will be happy to help.